This site did not show evidence of storing passwords in plaintext.
This site does allow secured connections (https)
This site did show a clear way to unsubscribe from their emails
This site does verify your email address.
Membership Emails
Below is a sample of the emails you can expect to receive when signed up to eig.
Last week, the Economic Innovation Group (EIG) released the 2020 Distressed Communities Index (DCI), a flagship research project consisting of a digital mapping interactive and a report, "The Spaces Between Us: The Evolution of American Communities in the New Century," that examines community well-being across the country down to the zip code scale. Examining cross-sections of the country by race, geography, and economy, the report found that:
Race: 50.5 million Americans reside in distressed communities, and 56 percent of them are people of color.
Geography: The population of prosperous urban zip codes doubled between 2000 and 2018 as well-being improved and the country''s urban geography expanded, especially in the West.
Economy: Nearly one-quarter of working adults in distressed zip codes are employed in the services sectors on the front-lines of the pandemic recession.
Join EIG tomorrow, October 20 at 2:00 p.m. ET for a webinar on the findings from "The Spaces Between Us." Panelists from EIG will demonstrate how the DCI can provide crucial context to support policy efforts that ensure the COVID-19 recovery is more inclusive than the recovery from the Great Recession.
Register for the Webinar
Explore Your Community
The DCI ranks major metro areas against each other based on key metrics such as vacancy rates and median household income. To explore how your community performs on the DCI, check out EIG's interactive map! Users can visualize how well-being varies across zip codes, counties, and congressional districts.
Copyright ? 2020 Economic Innovation Group, All rights reserved.
You are receiving this email because of your interest in the Economic Innovation Group''s research.
Our mailing address is:
Economic Innovation Group
616 H St NW
Washington, DC 20001-5800
Want to change how you receive these emails?
You can update your preferences or unsubscribe from this list.
Assessing the Economic Divide Between Red and Blue America
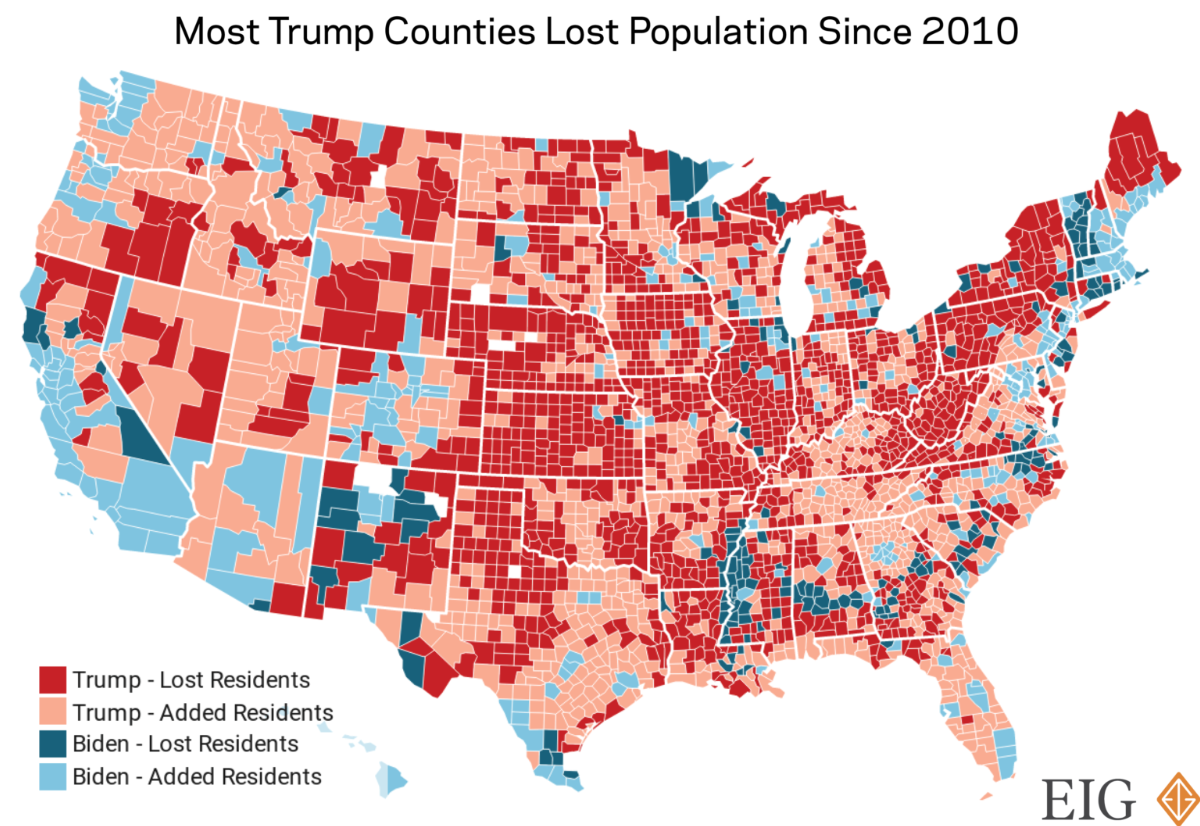
The 2020 election made clear that the American electorate is starkly divided. Several recent analyses from the Economic Innovation Group assess how Americans'' local economic experience-including growth in jobs, new businesses, and population in their communities-relates to their choices at the polls. Our research shows that outgoing President Donald Trump carried many of the nation''s slower growth (but also lower unemployment) areas, while President-elect Joe Biden dominated the country''s metropolitan landscape. The country''s related-and widening-economic and political gulfs call for a new generation of thinking to address our profound geographic inequality.
The Dynamism Divide
We examined the political map using three of the most tangible indicators of economic well-being in the counties supporting each presidential candidate: growth in population, growth in employment, and growth in the number of new businesses. On each measure, we found a profound gap between the cohort of counties that voted for President-elect Biden and those carried by President Trump. From 2010 to 2019, the number of people in counties won by Biden grew by an average of 3.1 percent over the period, compared to an increase of just 0.6 percent for Trump counties. Biden counties also accounted for a remarkable 82.5 percent of new businesses added to the economy and 72.8 percent of employment growth in that same time, underscoring the economic dominance that has accompanied their expanding populations. Read the full analysis here: The Dynamism Divide: Examining the 2020 Election Through the Lenses of Population Growth, Jobs, and Business Formation
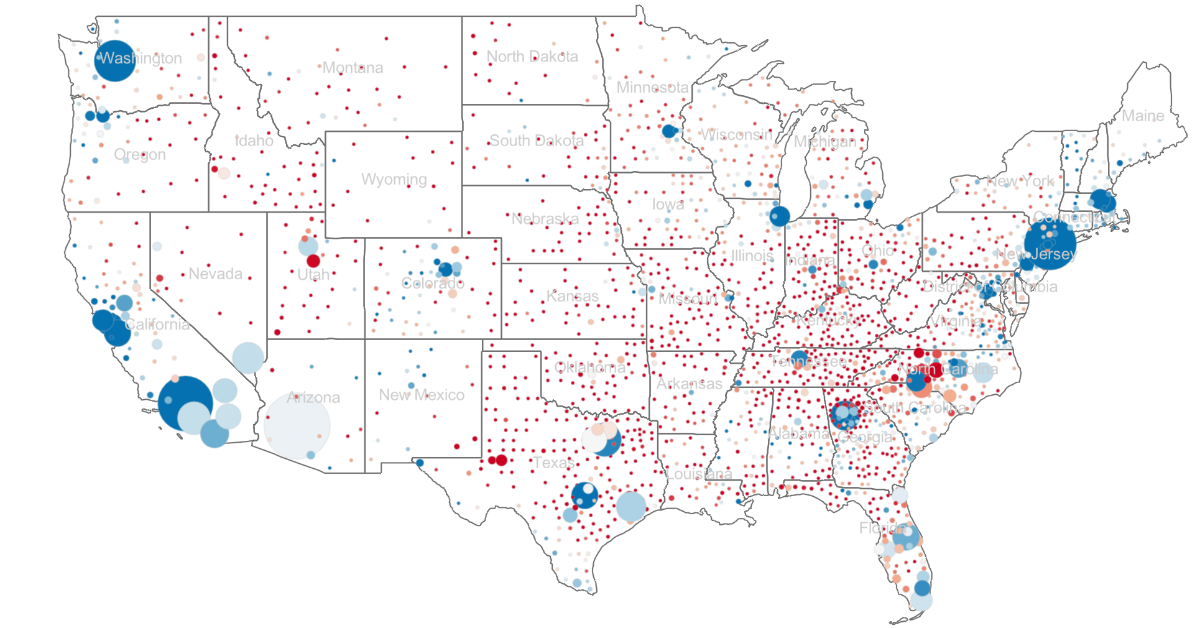
The Biggest Trump-Era Job Gains Were In Counties Biden Won
Counties that Biden won in the 2020 presidential election accounted for 68 percent of U.S. job growth from 2016 to 2019. By flipping Maricopa County, Arizona, which had gone to the Republican candidate in the past three presidential elections, Biden was able to win 19 of the 20 counties that had the biggest increases in total jobs. Of the counties that ranked between 20 and 100 for employment growth, Biden carried two-thirds. Explore the data snapshot and interactive map here: The biggest Trump-era job gains were in counties that Biden won
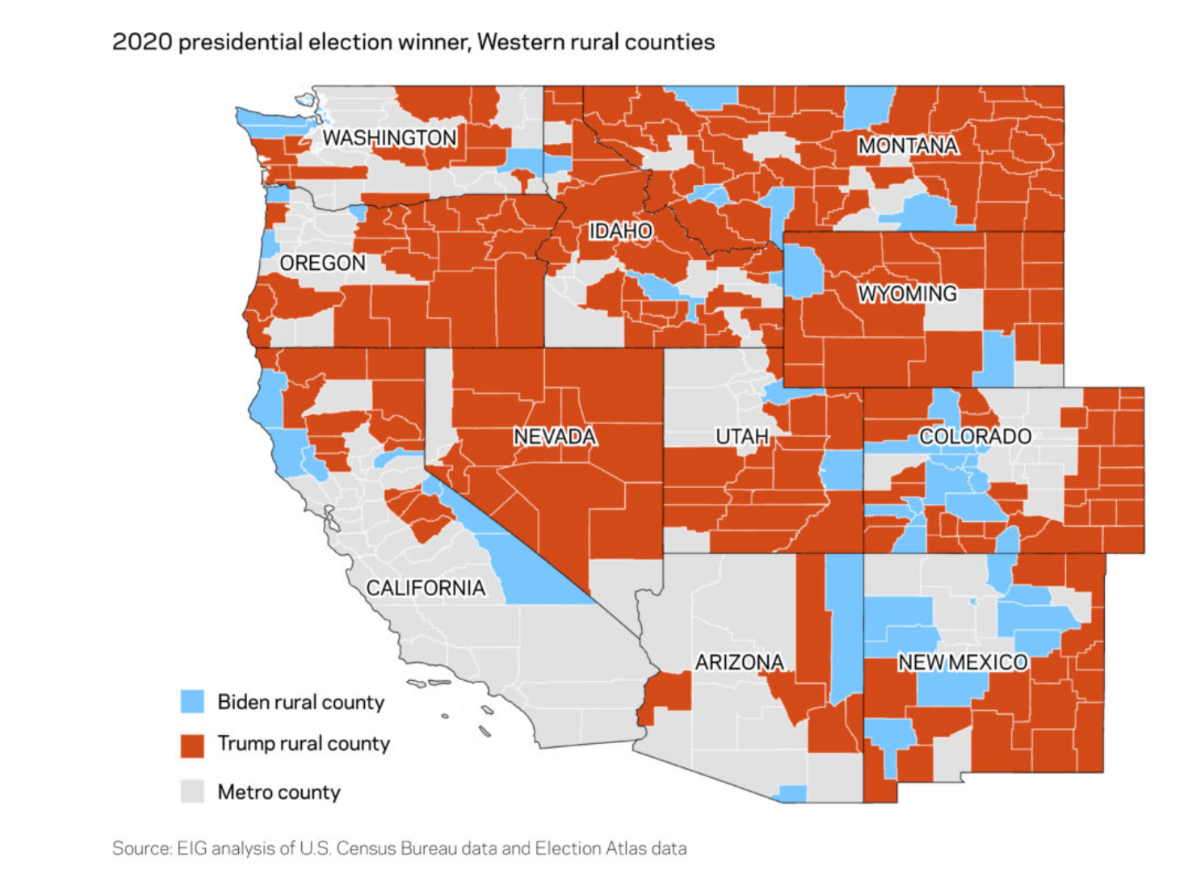
Rural America Is Not All Trump Country
Trump may have carried a dominating 90 percent of rural America''s vote in 2020, but what can rural counties that remain blue in a sea of red tell us? We looked at the characteristics of the 10 percent of rural communities that voted blue, finding that Biden generally performed well in rural areas with large tourism and recreation economies, high rates of in-migration, and growing and diverse populations. Read the full analysis here: Rural America is not all Trump country: A closer look at the rural counties that Biden won
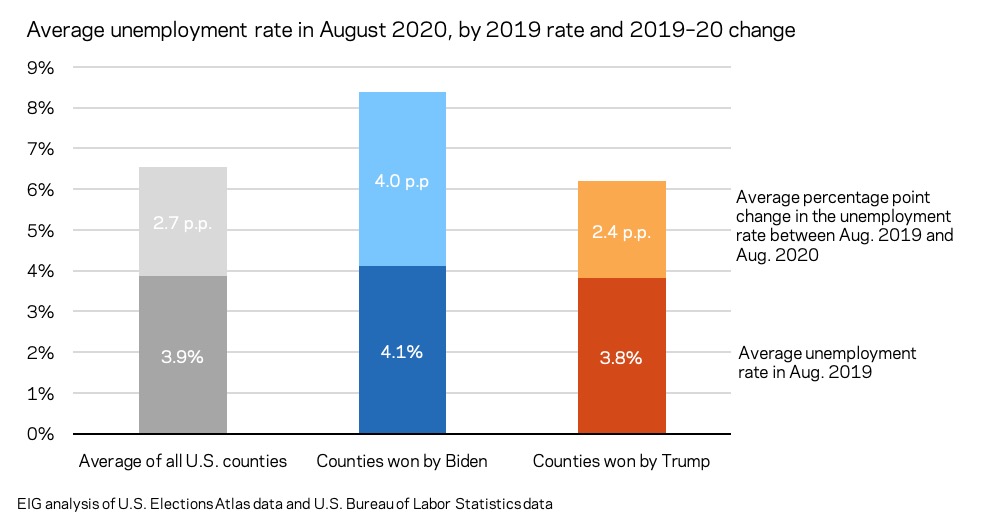
How 2020 Election Results Stack Up by County Economic Performance
How does the recent economic performance of counties that voted for President-elect Joe Biden and those that voted for President Donald Trump stack up? We found that while counties that went to Biden on average enjoyed slightly stronger economic growth in the two years prior to the pandemic, they were also hit harder by the economic fallout from the pandemic. In all, it appears that Biden performed well in counties that were experiencing stronger growth in employment, business establishments, and wages leading up to the pandemic. Read the full analysis here: How 2020 Election Results Stack Up by County Economic Performance
EIG Election Analyses in the News
The Wall Street Journal How the 2020 Election Deepened America's White-Collar/Blue-Collar Split Aaron Zitner, Dante Chinni, and Brian McGill - November 24, 2020
Reuters Trump touted the economy; the economy voted for Biden Howard Schneider - November 10, 2020
The Atlantic How to Reconnect Rural and Urban America James Fallows - November 25, 2020
The Washington Post Biden won places that are thriving. Trump won ones that are hurting Andrew Van Dam and Heather Long - November 15, 2020
TIME Trump Made the Economy His Message. Biden Won It. Philip Elliot - November 13, 2020
The Washington Post: Finance 202 Blue-collar counties continued their drift toward Trump''s GOP, setting up a challenge for Democrats Tory Newmyer - November 12, 2020
Bloomberg Biden Inherits Economic Laggards That Helped Doom Trump Campaign Shawn Donnan and Keith Naughton - November 9, 2020
Copyright ? 2020 Economic Innovation Group, All rights reserved.
You are receiving this email because of your interest in the bipartisan Opportunity Zones tax incentive.
Our mailing address is:
Economic Innovation Group
616 H St NW
Washington, DC 20001-5800
Want to change how you receive these emails?
You can update your preferences or unsubscribe from this list.
New EIG Study Underlines Stark Racial Gaps, Geographic Inequality Nationwide
Today, the Economic Innovation Group released the Distressed Communities Index (DCI), a timely research project that maps community well-being across the country down to the zip code scale. The report entitled, "The Spaces Between Us: The Evolution of American Communities in the New Century," is accompanied by a digital mapping interactive that allows users to explore all of the data included in the DCI across zip codes, counties, and congressional districts.
The DCI is designed to be a lens through which to evaluate where and for whom the country truly lives up to its promise as a land of opportunity. The Index sorts communities into five tiers (distressed, at risk, mid-tier, comfortable, and prosperous) using seven distinct economic indicators, enabling us to better understand the spatial distribution of U.S. economic well-being, and to examine how communities have evolved over time.
The events of this year have provided a series of sobering reminders that the terms of the American experience are too often dictated by race, place, and inequality. Those themes are at the heart of the new report. Our analysis looks back to the year 2000 to examine the arc of community well-being thus far in the 21st century. We find that while the U.S. has made significant progress towards more inclusive prosperity in thriving areas, national economic growth has fundamentally failed to raise the floor of well-being for the country''s most vulnerable people and communities.
More than just a research project, previous iterations of the DCI have been put to use by state and local governments, federal agencies, non-profit organizations, and academics across the country. From foundations targeting support to small businesses in vulnerable communities during the economic crisis to academics striving to better understand the social determinants of health, the DCI provides far-reaching insight into how - and where - we live. And at a time of national crisis, we hope this edition will be a resource to policymakers as they target emergency relief and lay the groundwork for a broad-based recovery that can truly reach the 50 million Americans living in distressed communities nationwide.
Key Findings from the Report
So far in the 21st century, national economic growth has failed to lift the country's most vulnerable communities.
On measures of income, poverty, joblessness, and vacancy, the typical distressed zip code remained just as far behind the typical prosperous zip code in 2018 as it was in 2000.
At 50.5 million, the number of Americans living in distressed communities held constant even as the country's population grew significantly.
A plurality of Americans (82.4 million) call prosperous zip codes home, but population increased fastest in the mid-tier category.
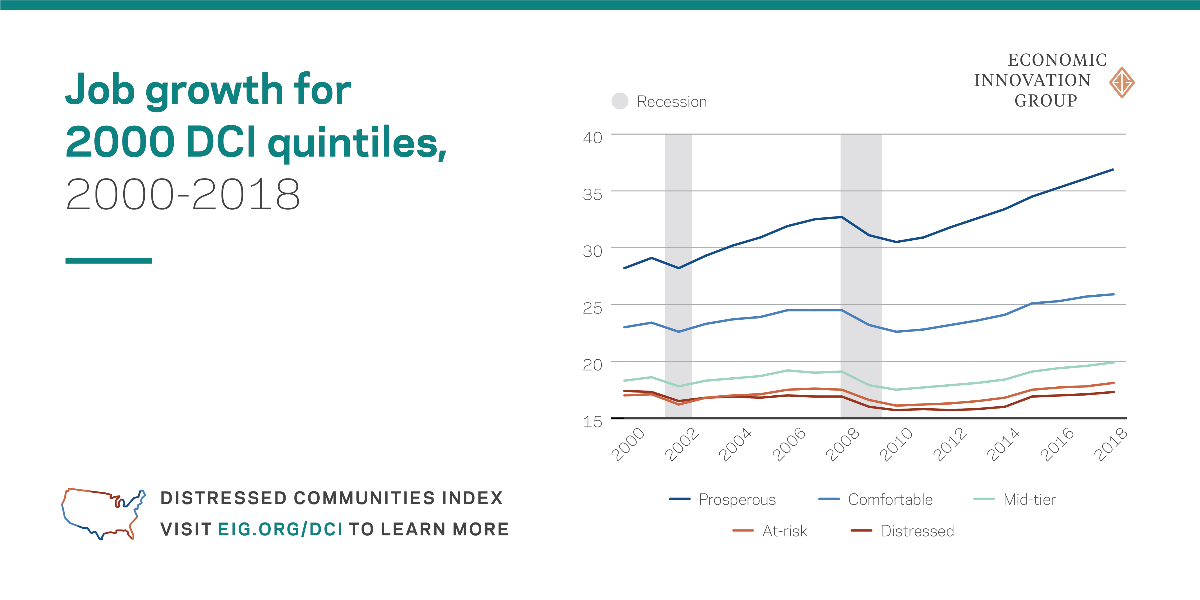
Zip codes that were prosperous in 2000 gained 8.7 million jobs between 2000 and 2018, generating nearly 62 percent of total U.S. job growth over the period.
Meanwhile, zip codes that were distressed at the turn of the century lost jobs on net between 2000 and 2018. Numbers of jobs and businesses in distressed communities even fell from 2014 to 2018, deep into the national recovery from the Great Recession.
Community-level advantages and disadvantages tend to perpetuate over time. Two-thirds of zip codes that ranked as prosperous in 2000 were prosperous in 2018. Likewise, two-thirds of zip codes that were distressed at the turn of the century remained so.
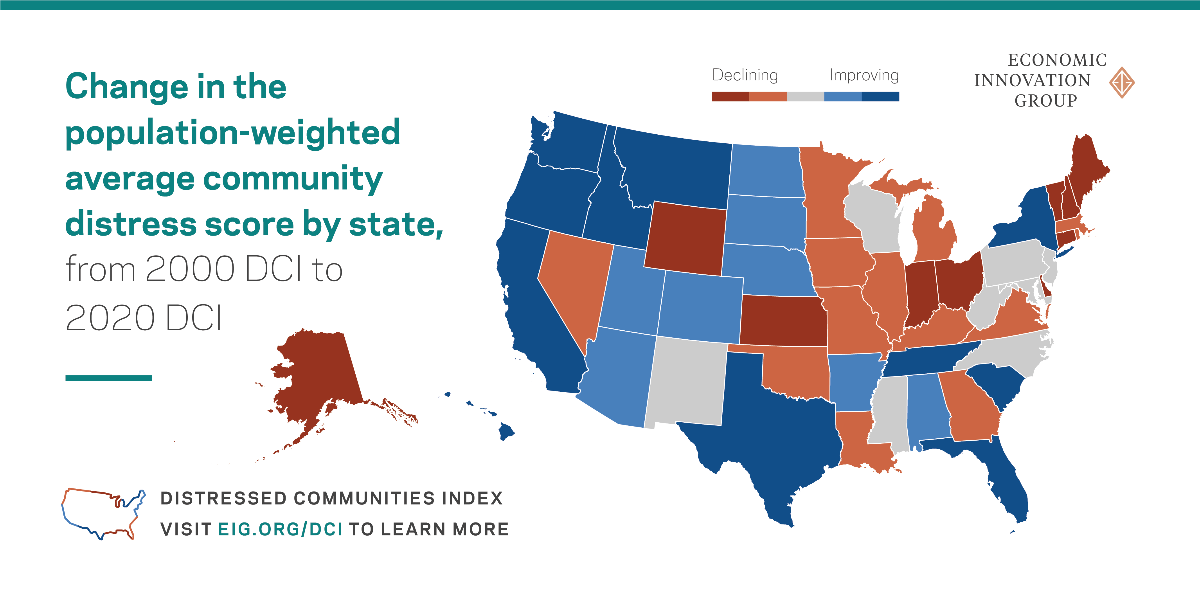
The geography of well-being has shifted as cities and
the West gain ground.
The total population of prosperous urban zip codes doubled from 2000 to 2018 as well-being improved in several cities and the country's urban geography expanded, especially in the West. These advances were uneven, however, as the number of prosperous zip codes flatlined or declined across 61 of the country's 100 largest cities.
The share of the country's urban population residing in distressed zip codes fell from 34.3 percent to 21.7 percent over the period-still slightly edging out the other quintiles. Meanwhile the share of rural Americans living in distressed zip codes rose to 23.6 percent.
In the West, 53.4 percent of the population resides in a prosperous or comfortable zip code, a greater share than in any other region. It displaced the Midwest, which led in American economic well-being in 2000 but now trails even the Northeast.
In spite of significant progress, Americans' exposure to
community prosperity and distress remains profoundly
divided along racial lines.
The minority share of the population in prosperous zip codes jumped from 16.3 percent to 26.9 percent between 2000 and 2018 and declined slightly in the distressed quintile to 56.4 percent, still leaving communities of color significantly overrepresented at the bottom.
The share of the country's Black population living in distressed zip codes declined from 45.6 percent in 2000 to 35.3 percent in 2018. But in the Midwest, fully half of the Black population still lives in distressed communities.
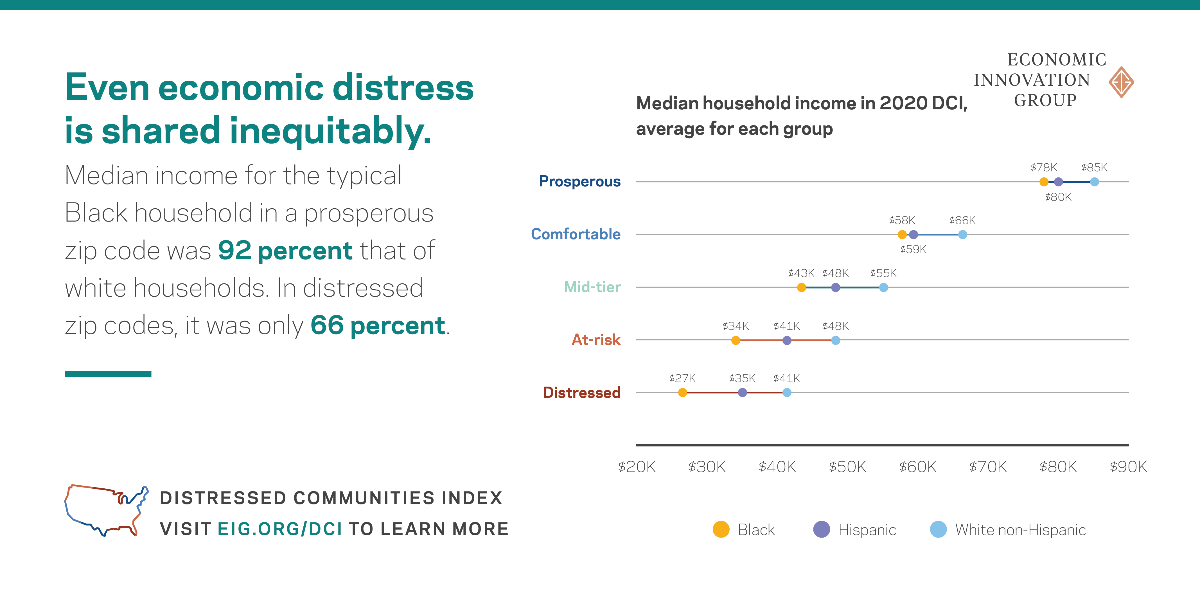
Racial inequality is observed at every level of community well-being, but especially in distressed areas, where the median income (MHI) for the typical Black household was only 66 percent that of the typical white household. Across every quintile, the typical Black MHI fell as a share of white MHI between 2000 and 2018.
An overwhelming 70 percent of majority-Black zip codes are distressed, compared to 20 percent of zip codes nationally and 16 percent of majority-white zip codes. Only 19 majority-Black zip codes rank as prosperous on the DCI.
Join the Webinar
Results and Analysis: 2020 Distressed Communities Index
Join the Economic Innovation Group on Tuesday, Oct. 20 at 2:00 p.m. ET for a webinar on the findings from the Distressed Communities Index. Panelists from EIG will demonstrate how the DCI provides crucial context for how to focus efforts to ensure the COVID-19 recovery is more inclusive than the recovery from the Great Recession.
Register
Explore Your Community
Explore how your community performs on the DCI. Users can visualize how well-being varies across zip codes, counties, and congressional districts.
Read about the DCI in Reuters
Copyright ? 2020 Economic Innovation Group, All rights reserved.
You are receiving this email because of your interest in the bipartisan Opportunity Zones tax incentive.
Our mailing address is:
Economic Innovation Group
616 H St NW
Washington, DC 20001-5800
Want to change how you receive these emails?
You can update your preferences or unsubscribe from this list.


 Arts and Entertainment
 Business and Industry
 Computer and Electronics
 Games
Games Health
 Internet and Telecom
 Shopping
 Sports
 Travel
 More
More